Streaming RAG for IIoT: using LLM to perform live analytic for asset performance management
Streaming RAG

Why “Streaming RAG” in IoT?
Classic RAG (Retrieval-Augmented Generation) assumes static documents. In IoT, knowledge changes every second. Streaming RAG means:
Ingest continuously (MQTT telemetry stream)
Index incrementally (append-only time-series + optionally semantic embeddings)
Retrieve just-in-time (latest values, last N minutes, anomalies)
Generate answers with streaming tokens (LLM starts answering immediately, keeps improving as retrieval completes)
This gives you a “living assistant” that can answer operational questions in real-time and trigger actions (alarms) deterministically.
Reference Architecture
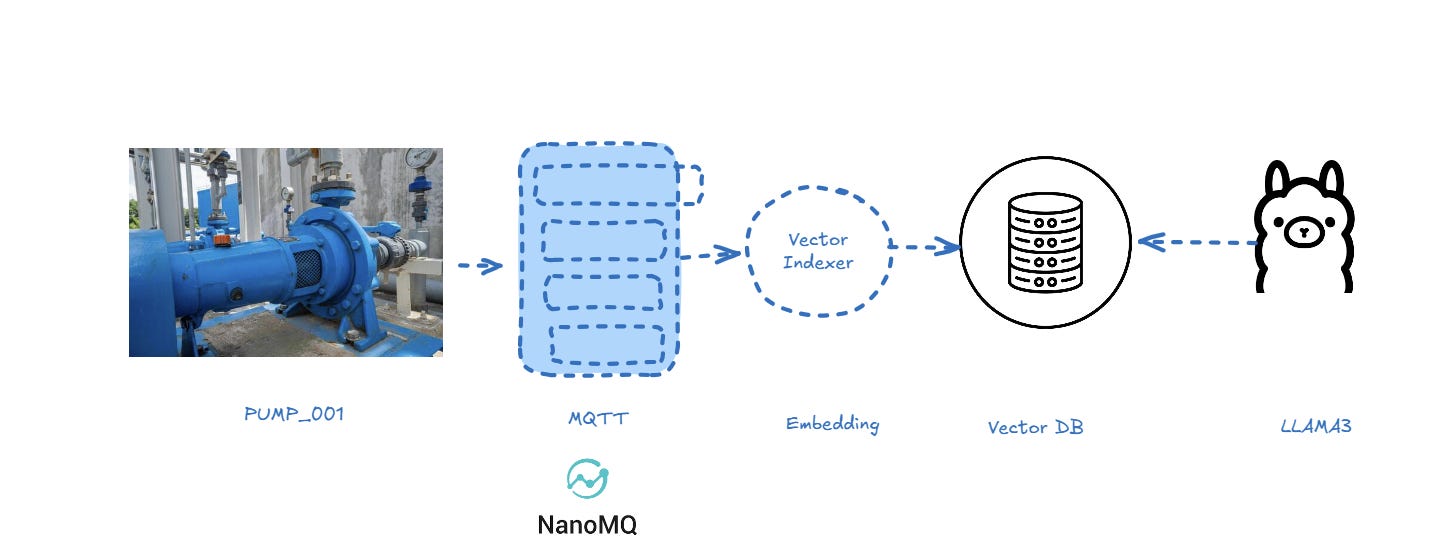
The proposed architecture is based on Python, Chroma DB, NanoMQ as MQTT Data Broker and LLAMA3.
1) Data flow (high-level)
PUM_001 (Edge PLC / sensor gateway) →
publishes JSON telemetry via MQTT →
NanoMQ → Python RAG service (ingest + index + query) →
Ollama (Llama3) for natural-language response (streaming) →
optional Alarm topic back on MQTT.
2) Logical components
A. MQTT Layer (NanoMQ)
Broker: NanoMQ
Topics (example):
Telemetry:
iot/pumps/PUM_001/telemetryAlarms:
iot/pumps/PUM_001/alarms(Optional) Query channel:
iot/assistant/query
B. Indexing Layer (Streaming Index)
Use two complementary indices:
Time-series index (mandatory)
Lightweight store (SQLite is perfect to start)
Schema:
(asset_id, ts, speed, pressure, temp, vib, raw_json)Purpose: deterministic retrieval of latest values, windows, aggregates
Semantic index (optional, “RAG” part)
Embed “telemetry summaries” (e.g., “At 19:50, speed=120 rpm, pressure=…”)
Used for fuzzy questions: “when did the pump start overspeeding?”, “what changed before the alarm?”
You can keep this optional; the “last speed” use case is best solved via SQL.
C. Reasoning/Response Layer (Ollama + Llama3)
Llama3 receives:
the user question
the retrieved facts (latest telemetry row, thresholds, context)
It returns a streamed response (tokens streamed) for a responsive UX.
3) How to test
The complete project is available here
https://github.com/venergiac/iiot-streaming-rag.git
To run the code
git clone https://github.com/venergiac/iiot-streaming-rag.git
Now you can start the publisher using directly the publisher simulator:
import json
import paho.mqtt.client as mqtt
import datetime, time, random

client = mqtt.Client()
client.connect("nanomq", 1883, 60)
client.loop_start()


asset_id="PUMP_001"

sensors = ["bearing_temp", "speed", "vibration_rms"]
units = ["degC", "mm/s", "rms"]
values = [100, 1000, 1]
payload_events = {"ts":"{time}","asset_id":"{asset_id}","sensor":"{sensor}","value":"{value}","unit":"{unit}"}


while True:
    events=[]
    for value, sensor, unit in zip(values, sensors, units):
        _payload = payload_events.copy()
        _payload["ts"] = datetime.datetime.now().strftime('%Y-%m-%dT%H:%M:%S.%f%z')
        _payload["asset_id"] = asset_id
        _payload["sensor"] = sensor
        _payload["value"] = random.randint(0, value)
        _payload["unit"] = unit

        events.append(_payload)

    _payload = {"asset_id": asset_id, "events":events}
    #print("Publish:", _payload, "=>", f"factory/ACME/telemetry/{asset_id}")
    client.publish(f"factory/ACME/telemetry/{asset_id}", payload=str(_payload).replace("'","\""), qos=1, retain=False)

    # wait 30 secs
    time.sleep(30)
The simulator is publishing 3 sensors every 30 secs.
From command console start the services:
docker compose up
Than connect to:
http://localhost:8888/notebooks/work/iiot_edge.ipynb
Now you can start the processor:
import json
import paho.mqtt.client as mqtt

def on_message(client, userdata, msg):
    payload = msg.payload.decode("utf-8")
    print(f"Received '{msg.payload.decode()}' from '{msg.topic}' topic")
    # payload deve essere JSON con ts, asset_id, sensor, value ...
    payload = json.loads(payload)

    asset_id = payload["asset_id"]
    events = payload["events"]

    process(asset_id, events, q="Read last speed of PUMP_001 and raise an alarm if speed greater than 100", lookback_minutes=10)

client = mqtt.Client()
client.on_message = on_message
client.connect("nanomq", 1883, 60)
client.subscribe("factory/+/telemetry/#")
client.loop_forever()
You can find the processor accessing to jupyter notebook:
http://localhost:8888/notebooks/work/rag_stream.ipynb
⏲️Wait 30 secs and voilà; after receiving the first message
Received ‘{”asset_id”: “PUMP_001”, “events”: [{”ts”: “2026-03-21T12:32:51.727843”, “asset_id”: “PUMP_001”, “sensor”: “bearing_temp”, “value”: 97, “unit”: “degC”}, {”ts”: “2026-03-21T12:32:51.727885”, “asset_id”: “PUMP_001”, “sensor”: “speed”, “value”: 885, “unit”: “mm/s”}, {”ts”: “2026-03-21T12:32:51.727891”, “asset_id”: “PUMP_001”, “sensor”: “vibration_rms”, “value”: 0, “unit”: “rms”}]}’ from ‘factory/ACME/telemetry/PUMP_001’ topicThe processor will inspect the message calling Ollama:
Read last speed of PUMP_001 and raise an alarm if speed greater than 100
Based on the provided telemetry data, I found that the last recorded speed of PUMP_001 is 885 mm/s, which is greater than the threshold of 100 mm/s.

Root-cause hint: The sudden increase in speed may be due to a blockage or obstruction in the pump’s flow path, causing the pump to work harder and increase its speed.

Anomalies:

* The speed value of 885 mm/s is significantly higher than the previous recorded values, indicating a potential anomaly.
* The vibration_rms value remains low (0-1 rms), which may indicate that the pump is not experiencing significant vibration issues.
An alert is immediately raised.
Conclusions
Maybe this is not right way to build analytics because is not able to scale up too much, but using streaming RAG you can perform very interesting analysis live on your Industrial data.